
 Download App
"User satisfaction" isn't a metric, it's a construct you can't observe directly. Metric design for AI products means picking observable proxies for that construct, checking they actually move with real satisfaction, and committing to one you can defend in a review. That translation process is what measuring user satisfaction actually means.
Why "user satisfaction" fails the moment it hits a dashboard
Put "user satisfaction" on a dashboard without defining it first, and three things go wrong at once.
First, nobody agrees on what it means. Product wants engagement, support wants low ticket volume, leadership wants a number that correlates with revenue. All three call it "satisfaction," but they're describing different constructs that happen to share a label.
Second, a single vague number invites a single vague proxy, usually a survey score, because it's the easiest thing to bolt onto a dashboard. Surveys under-sample your unhappiest users (they've already churned and stopped answering) and over-sample the people who love filling out forms.
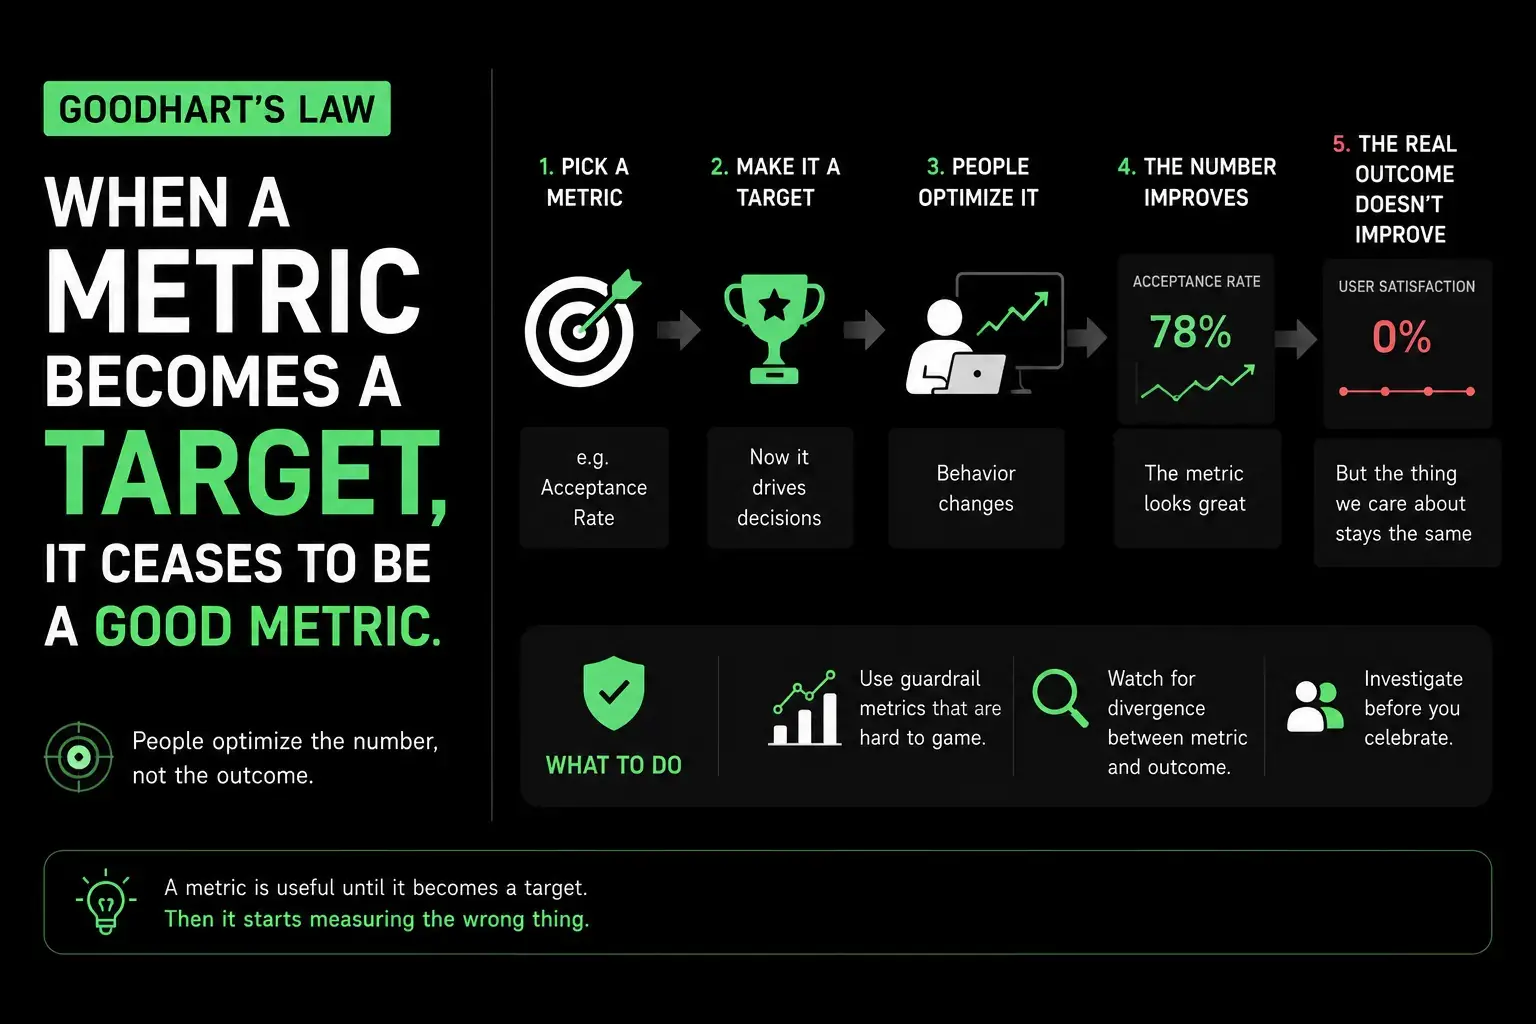
Third, once a number is on a dashboard, someone's compensation eventually depends on it. This is the setup for Goodhart's Law: once a measure becomes a target, people optimize the measure instead of the thing it was supposed to represent. The economist Charles Goodhart made a narrower point about monetary policy in 1975; the version everyone quotes today, "when a measure becomes a target, it ceases to be a good measure," is the anthropologist Marilyn Strathern's paraphrase, and it's the one that actually applies to product metrics.
What actually counts as a measure of user satisfaction?
There's no single correct proxy. There are three families, and a serious metric usually draws from more than one.
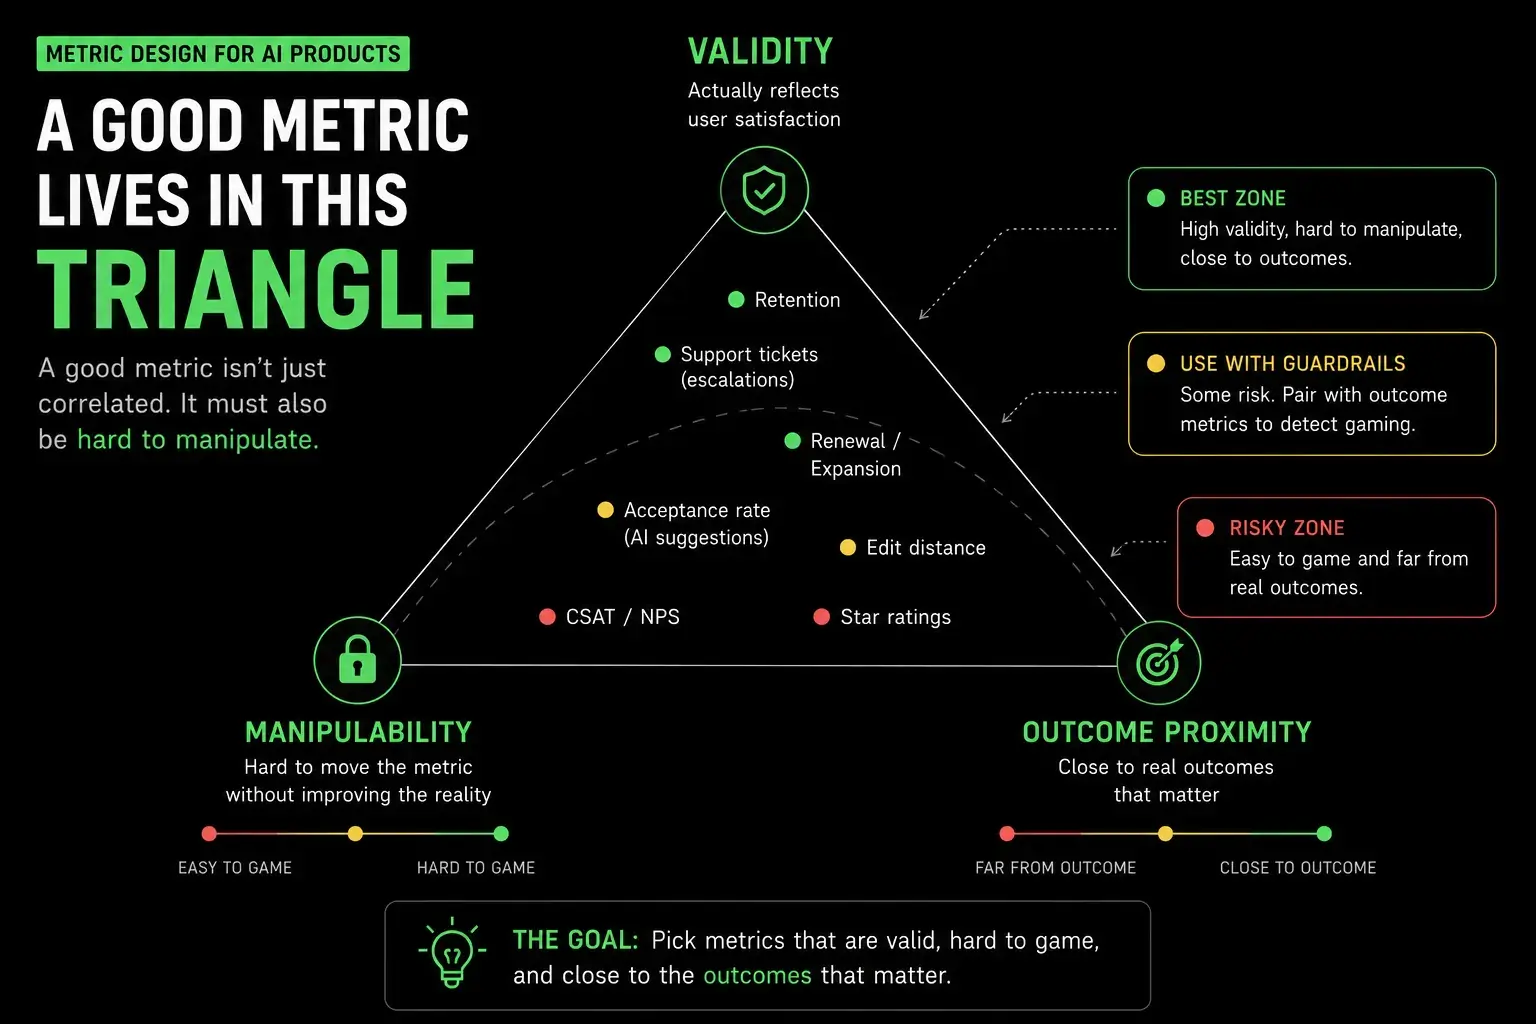
Explicit signals are what users tell you directly: CSAT ("how satisfied were you with this interaction, 1-5"), NPS ("how likely are you to recommend this"), star ratings, in-app surveys. Cheap to collect, cheap to game, and biased toward whoever bothers to respond.
Behavioral signals are what users do without being asked. For AI products specifically, this is where the interesting proxies live: suggestion acceptance rate, how often a user regenerates or edits an AI response before using it, whether they copy the output at all, session return rate, and how quickly they abandon a task after an AI-assisted step. A high regeneration rate isn't neutral, it usually means the first answer wasn't good enough.
Outcome signals sit downstream of the interaction: retention, renewal, expansion revenue, support escalation rate, referral. These are the hardest to fake and the slowest to move, which makes them the right target for validating everything else.
How metric design for AI products actually works
Write the construct down in one sentence. Not "user satisfaction," but "satisfaction with the accuracy of AI-generated code suggestions in the first 10 seconds after they appear." Specificity here saves you from six weeks of stakeholder disagreement later.
Brainstorm candidate proxies without filtering. Aim for 8-10: explicit ratings, acceptance/edit rates, time-on-task, abandonment, support tickets, retention deltas. Quantity first, judgment second.
Score each candidate on two axes: validity and manipulability. Validity asks whether the proxy actually moves when true satisfaction changes. Manipulability asks how cheaply someone (a user gaming a reward, or your own team gaming an OKR) can move the number without the underlying reality changing.
Pick one primary metric and one or two guardrails, not a giant weighted index. A single acceptance-rate metric with a guardrail on support escalations tells a clearer story than a composite score that quietly averages away a regression in one dimension.
Validate before you trust it. Correlate your chosen proxy against a costly-to-fake outcome, retention or renewal are the standard choices, over a real cohort before it goes on any leadership dashboard. If the correlation is weak, the proxy isn't measuring what you think it's measuring, no matter how intuitive it feels.
Worked example: an AI coding assistant
Say you're building the satisfaction metric for an AI pair-programming feature. Step one, the construct: "developers trust the suggestions enough to use them with minimal editing." Step two produces candidates like acceptance rate, edit distance between suggestion and final code, time-to-accept, thumbs up/down, weekly active usage, and support tickets tagged "bad suggestion."
Step three eliminates thumbs up/down fast: only a small, self-selected sliver of users ever click an inline feedback widget, and the ones who do skew toward people having an unusually good or unusually bad moment. Acceptance rate and edit distance survive: both are logged automatically, both are expensive to fake (a user can't inflate "acceptance" without actually using more suggestions), and both plausibly track the construct.
Step four lands on suggestion acceptance rate as the primary metric, with edit distance on accepted suggestions and 7-day retention of active users as guardrails, catching the case where acceptance rate climbs because the bar for "good enough" dropped, not because suggestions improved.
A rough query for the primary metric, aggregated weekly per user cohort:
SELECT
  date_trunc('week', suggested_at) AS week,
  COUNT(*) FILTER (WHERE accepted) * 1.0 / COUNT(*) AS acceptance_rate
FROM ai_suggestions
WHERE suggested_at >= NOW() - INTERVAL '90 days'
GROUP BY 1
ORDER BY 1;
Step five, validation, means pulling a cohort and checking whether acceptance rate actually predicts retention before trusting it:
import pandas as pd

# one row per user: their acceptance_rate and whether they retained at day 30
df = pd.read_sql("SELECT user_id, acceptance_rate, retained_d30 FROM user_metrics", conn)
correlation = df["acceptance_rate"].corr(df["retained_d30"])
print(f"acceptance rate vs. d30 retention: {correlation:.2f}")
If that correlation is near zero, acceptance rate is measuring something (maybe just usage volume) other than satisfaction, and it's back to step two.
How do you know when a satisfaction metric is being gamed?
Watch for a proxy that improves while an adjacent, harder-to-fake signal stays flat or worsens. If acceptance rate climbs but retention and support-ticket-free sessions don't move with it, someone (a team, a feature, occasionally an algorithm) found a way to inflate the number without improving the experience it's supposed to represent.
The fix is rarely to abandon metrics altogether. It's to keep a guardrail metric that's expensive to manipulate sitting next to every primary metric that's cheap to manipulate, and to treat a primary metric moving alone, with no guardrail movement, as a signal to investigate rather than a win to celebrate.
The takeaway
Don't try to measure "satisfaction." Measure a specific, one-sentence construct, pick a primary proxy and a guardrail that's hard to fake, and validate the pairing against a real outcome before it goes anywhere near a performance review. The framework matters more than which proxy you land on, because the proxy will need replacing long before the framework does.
Sources
Charles Goodhart's original 1975 point about monetary targets, and Marilyn Strathern's widely-cited 1997 paraphrase ("When a measure becomes a target, it ceases to be a good measure"), from Strathern, M. (1997). "'Improving ratings': audit in the British University system." European Review, 5(3), 305-321.
Fred Reichheld introduced the Net Promoter Score framework in "The One Number You Need to Grow," Harvard Business Review, December 2003.
FAQ
Is NPS a good satisfaction metric for AI products?
It's a reasonable secondary signal, not a primary one. NPS was built for consumer brands with infrequent purchase decisions; it responds slowly, gets skewed by response bias, and says nothing about whether a specific feature is working. Pair it with behavioral proxies measured every session, not just quarterly.
How many metrics should a satisfaction dashboard have?
One primary metric and one or two guardrails. A dashboard with ten satisfaction-adjacent numbers isn't more rigorous, it's a place where nobody can tell you which number moved and why. Composite indices are fine internally but should resolve to a single number leadership tracks.
What's the difference between a construct and a metric?
A construct is the unobservable thing you actually care about, like 'satisfaction' or 'trust.' A metric is an observable proxy you've chosen to stand in for it. Confusing the two is how teams end up optimizing a number that stopped tracking the thing it was meant to represent.
Can you fix a metric once people start gaming it, or do you have to replace it?
It depends on whether the gaming is a measurement flaw or an incentive flaw. If the proxy itself is weak, redesign it. If the proxy is sound but a bonus or OKR is pushing people to inflate it, fix the incentive first, replacing the metric will just move the gaming to whatever replaces it.
How often should a satisfaction metric be revalidated?
Re-run the correlation check from step five whenever the product, the user base, or the incentive structure changes meaningfully, and at minimum once or twice a year even if nothing obviously changed. Metrics decay quietly; nobody announces the day a proxy stopped meaning what it used to.